OPERATING AND FINANCIAL PERFORMANCE
This material references Disclosure 102-7 of GRI 102: General Disclosures 2016, and 201-1 of GRI 201: Economic Performance 2016
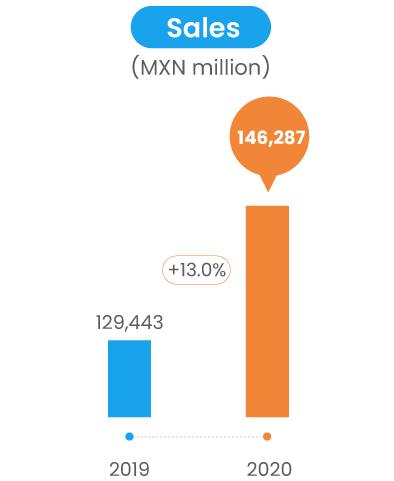
Consolidated Sales increased from Ps.129,443 million in 2019 to Ps.146,287 million in
2020, up 13.0% YoY (Guidance: 7% - 8%), mainly driven by higher demand in Mexico and the United
States fueled by the context caused by COVID-19 backdrop, which was capitalized on through the
timely execution of highly effective commercial strategies.
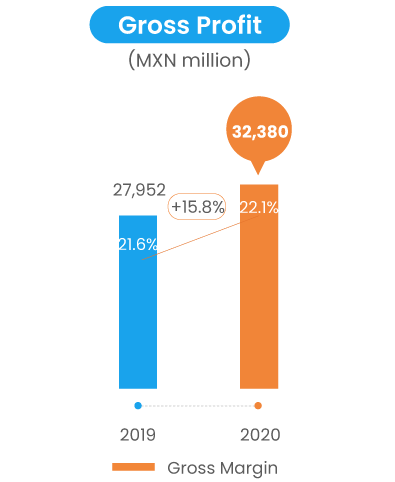
During 2020, Gross Profit amounted to Ps.32,380 million, growing 15.8% compared to
the Ps.27,952 million in 2019, with a gross margin of 22.1% (+ 0.5 p.p. YoY). This result was
attributed to the higher gross margins achieved at El Super and Fiesta stores in the United
States, along with a solid performance at Mexico Retail segment.
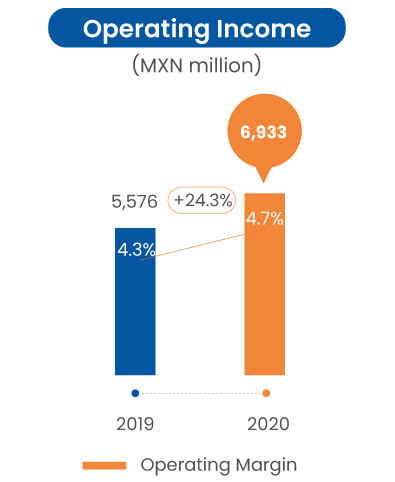
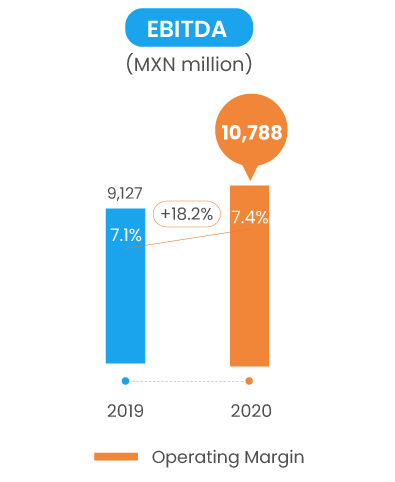
As gross profit growth outpaced operating expenses (thanks to cost mitigation initiatives and a more efficient operation in the United States), 2020 Operating Income and EBITDA rose 24.3% and 18.2% compared to 2019, with margins of 4.7% (+0.4 pp. YoY) and 7.4% (+0.3 pp. YoY), respectively.
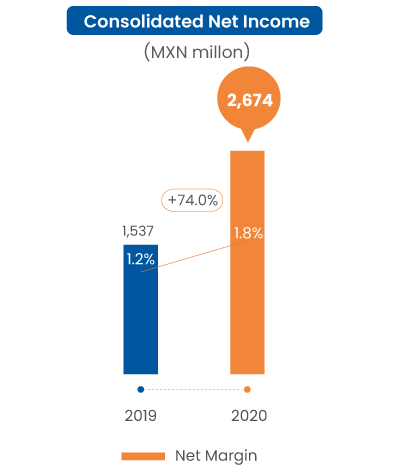
In 2020, Consolidated Net Income posted an outstanding growth of 74.0% compared to
2019, supported by the positive results achieved in all P&L lines, as well as by the lower debt,
leading to a virtually unchanged financing cost compared to 2019. Consequently, net margin stood
at 1.8% (+0.6 pp. YoY).
Consolidated Income Statement
| Figures in millions of pesos | 2019 | 2020 | Net change |
|---|---|---|---|
| Net Sales | 129,443 | 146,287 | 13.0% |
| Gross Profit | 27,952 | 32,380 | 15.8% |
| Operating Expenses (excluding depreciation) | 18,825 | 21,591 | 14.7% |
| EBITDA | 9,127 | 10,788 | 18.2% |
| Consolidated Net Income | 1,537 | 2,674 | 74.0% |
| Net Majority Income | 1,566 | 2,589 | 65.3% |
| Basic Earnings Per Share | 1.64 | 2.71 | 65.2% |
| Outstanding Shares | 963,917,211 | 963,917,211 | N/A |
| Share Price (Dec. 31) | 27.12 | 28.76 | 6.0% |
Consolidated Balance Sheet
| Figures in millions of pesos | 2019 | 2020 | Net change |
|---|---|---|---|
| Cash | 984 | 5,445 | >100.0% |
| Inventory | 13,471 | 11,986 | (11.0%) |
| Fixed Assets (Net) | 68,793 | 69,172 | 0.6% |
| Total Assets | 87,392 | 90,450 | 3.5% |
| Suppliers | 18,446 | 19,493 | 5.7% |
| Total Liabilities | 59,982 | 61,168 | 2.0% |
| Majority Shareholder Investment | 27,410 | 29,281 | 6.8% |
Guidance 2020 (Issued prior to the pandemic)
| Concept | Target | Actual |
|---|---|---|
| Consolidated Net Sales | 7% - 8% growth | +13.0% |
| Mexico SSS | Growth around 4% | +5.5% |
| US SSS (USD) | 1.5% - 2% growth | +7.7% |
| CAPEX / Consolidated Net Sales | Growth around 2% | 1.7% |
| Sales Floor in Mexico | 3.4% growth | +1.8% |
| Mexico EBITDA Margin | Growth around 7.2% | 7.4% |
| Real Estate Division EBITDA Margin | Growth around 69.3% | 60.2% |
| El Super EBITDA Margin | 6.5% - 7% | 8.0% |
| Fiesta EBITDA Margin | 4.5% - 5% | 4.8% |
| Net Bank Debt / EBITDA | Around 0.7 times | 0.36 times |
| Store Openings | 7 Tiendas Chedraui 3 Súper Chedraui 20 Supercitos |
6 Tiendas Chedraui 3 Súper Chedraui 11 Supercitos |
Retail Operation Highlights
| Stores in Mexico | 2019 | 2020 | Net change |
|---|---|---|---|
| Tiendas Chedraui | 198 | 202 | 4 |
| Súper Chedraui | 60 | 64 | 4 |
| Súper Che | 15 | 11 | (4) |
| Supercitos | 33 | 44 | 11 |
| Total in Mexico | 306 | 321 | 15 |
| Stores in US | 2019 | 2020 | Net change |
|---|---|---|---|
| El Super | 64 | 64 | - |
| Fiesta Mart | 61 | 59 | (2) |
| Total in the United States | 125 | 123 | (2) |
| Total Stores | 2019 | 2020 | Net change |
|---|---|---|---|
| Stores | 431 | 444 | 13 |
| Sales floor (m2) | 2019 | 2020 | Net change |
|---|---|---|---|
| Stores in Mexico | 1,466,714 | 1,493,183 | 1.8% |
| Stores in US | 358,591 | 352,861 | (1.6%) |
| Total | 1,825,305 | 1,846,044 | 1.1% |
RETAIL IN MEXICO
As part of our commitment to consolidate our presence in the region, and despite the challenging backdrop (marked by restrictions on certain activities, including construction and/or renovations), we expanded our total sales floor in Mexico by approximately 27,000 m2 (+1.8% YoY), with the net incorporation of 15 stores.
This result is explained by: 1) the opening of 6 Tiendas Chedraui and 3 Súper Chedraui stores; 2) the inauguration of 11 Supercitos; and, 3) the conversion of 1 Súper Che to Súper Chedraui. These openings include the incorporation of one Tienda Chedraui and one Súper Chedraui store under the Selecto concept.
Qualifying as an essential activity for the health contingency and notwithstanding major operational challenges (mostly related to multiple operating restrictions imposed in the different jurisdictions where we operate), the Retail segment in Mexico stood out for its resilience, posting increases of 7.1 % and 8.6%, in Sales and EBITDA, respectively, totaling Ps.82,536 million and Ps.6,068 million.
Also noteworthy was the 5.5% growth in Retail Mexico same-store sales, which was driven by shifting customer consumption patterns brough about by the health contingency. This figure is positively compared to the sector performance, as reported by the Mexican retailers’ association (+5.5% vs. +5.4%).

| Figures in millions of pesos | 2019 | 2020 | Net change |
|---|---|---|---|
| Sales | 77,090 | 82,536 | 7.1% |
| EBITDA | 5,589 | 6,068 | 8.6% |
| EBITDA Margin | 7.2% | 7.4% | 0.2 p.p. |
RETAIL IN THE US

In 2018, we met the operational challenge posed by the acquisition of Fiesta Mart, L.L.C., a company that operated under a higher expense/sales structure than that of Mexico. Consequently, in 2019, we focused on the consolidation of the Fiesta stores, providing the required momentum to obtain satisfactory results in 2020, combined with the operation of El Super, which benefited from a stronger demand.
In this regard, the Retail segment in the United States posted a 22.6% increase in sales compared to 2019, mainly attributable to the double-digit revenue growth in Fiesta stores and, to a lesser extent, to a favorable calendar effect, as 2020 had an additional week compared to 2019. Similarly, same-store sales increased 7.7% YoY in U.S. dollars and on a comparable 52-week basis.
Meanwhile, EBITDA expanded 49.6% YoY to Ps.4,207 million, well ahead of sales growth, reflecting the operational improvements that Chedraui has been able to achieve in this country. EBITDA margin increased 1.2 p.p. to end 2020 at 6.7%.
| Figures in millions of pesos | 2019 | 2020 | Net change |
|---|---|---|---|
| Sales | 51,304 | 62,899 | 22.6% |
| EBITDA | 2,811 | 4,207 | 49.6% |
| EBITDA Margin | 5.5% | 6.7% | 1.2 p.p. |
EBITDA Breakdown
| Figures in millions of pesos | 2019 | 2020 | Net change |
|---|---|---|---|
| El Super | 2,075 | 2,945 | 41.9% |
| Fiesta | 736 | 1,262 | 71.4% |
| Total | 2,811 | 4,207 | 49.6% |
REAL ESTATE DIVISION
In 2020, the Real Estate Division’s revenues contracted 18.7% compared to 2019, derived from the effects of temporary adjustments in rent payments, which we expect to be normalized throughout 2021. On the other hand, and notwithstanding the restrictions on non-essential activities, we managed to incorporate 10,317 m2 (+ 2.8% YoY) of leasable area.
EBITDA from this division decreased 29.3% YoY, mostly explained by costs related to the closure of some properties in response to the COVID-19 pandemic, during which we overcame other challenges to permanently offer an experience that complies with health and safety standards, for the benefit of our stakeholders.
| Figures in millions of pesos | 2019 | 2020 | Net change |
|---|---|---|---|
| Sales | 1,048 | 852 | (18.7%) |
| EBITDA | 727 | 513 | (29.3%) |
| EBITDA Margin | 69.3% | 60.2% | (9.1 p.p.) |
Financing
During 2020, following our cash flow generation approach, net bank debt amounted to Ps.3,903 million (-59.0% YoY), comprised of Ps.3,162 million short-term, Ps.6,186 million long-term debt, and Ps.5,445 million in cash and temporary investments.
Consequently, thanks to lower net debt and EBITDA growth, the net bank debt to EBITDA ratio for the last twelve months was 0.36 times, a significant improvement over the 1.04 times recorded at year-end 2019.
On the other hand, it is relevant to note that, when considering only our Mexico business, the net bank debt is negative for Ps.769 million.
Although debt is reported on a consolidated basis, the debt contracted by the Mexican operation is in Mexican pesos, while the debt contracted by the U.S. operation is in U.S. dollars, which is not hedged because the exchange rate risk is naturally covered by the division's dollarized revenues.
Regarding capital investments, the accumulated CAPEX from January to December 2020 reached Ps.2,527 million.